
How do you set up iSolarCloud monitoring?
If we were unable to set up iSolarCloud monitoring for you on the day, please follow these easy user-friendly steps below (which are also guided by the app assistant in the app) to register and create your plant.
You can also refer to this video here:
For a visual run-through of how to set up your isolarcloud monitoring.
You can download the iSolarCloud monitoring app from the relevant App Store for your phone type (iPhone = istore; Android phone = Google Play Store) You will need this app to access the isolarcloud account.
If we have set up your isolarcloud account, you should have received an email from isolarcloud advising you of your login details. However, if you cannot locate this email, your login name will be the email address that you have supplied Watts Up Solar and Electrical with or the email address that you supplied the installer with on the day of installation when they were setting up your account.
If you need to reset your password, at the iSolarCloud login screen simply go to Forgot Password and follow the instructions, it will guide you through the process. This is useful if you do not know your password or if you have forgotten it.
If we have set up for isolarcloud account and you are on login that your plant is offline – please refer to SECTION 3 of this document to reconnect your WIFI.
Once you log in to the isolarcloud app you will see your plant details. Click on the plant to view your monitoring data. Refer to the information below in SECTION 2 How to read your isolarcloud – App Explanation.
1. Install the iSolarCloud app
Download the iSolarCloud app from Google Play or App Store.
Install the app and open it once it is installed.
2. Select your server
Opening the app, you’ll receive a pop-up to confirm your current service address.
For Australia, it is an “Australian server.”
Select this and click “confirm” to continue to the login screen.
3. User registration
Click “register” to create an iSolarCloud account.
On the registration page, select the “End User” option.
Then enter your email address and select “send verification code.”
Enter the verification code sent to your email into the appropriate field. Check your spam folder if you don’t see it in the inbox.
Then create a password, select your location, and time zone, accept the privacy policy, and click “register.”
You can then log in using your email and the password you created to go to the iSolarCloud home screen.
Accept the pop-ups that show up to give the app access to important features.
4. Create plant
Select “Create Plant” so that you can connect your inverter.
Select your plant type (residential or commercial).
Select your inverter type (PV or Hybrid). once you have selected the inverter type, the app will prompt you to select the communication method.
Select WLAN if connecting to home internet using the Wi-Fi dongle else select Ethernet if connecting to home internet using an ethernet cable.
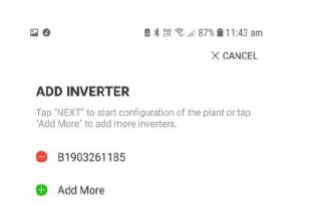
For using WLAN, the app will take you through the Wi-Fi configuration step which will automatically add the dongle to the plant (Figure 1). For Ethernet, you will need to input the SN of the inverter
NOTE: The ethernet option is only currently available for Hybrid inverters. To monitor PV / Grid-Connected inverters, you will need to use the WLAN option
5. Wifi Setting
Here is where you must connect your device to your inverter. Open Wifi settings on your mobile device and tap the name of your inverter. It is usually “SG-” followed by a series of numbers (which Will be the WIFI Dongle Serial Number)
If a password is required, the password is a serial number located on your WIFI Dongle. Once connected, return to the iSolarCloud app. You’ll see a “successfully connected” message. Click “Next”
The next page is to connect your inverter to the internet. Select your home Wifi, enter the password (if applicable), and press “confirm.” Then connect your device back to your home network.
Go back to your Wifi settings, disconnect your device from the inverter and connect back to the internet.
Return to the iSolarCloud app. You’ll see a “successfully connected” message showing that your device is now connected to the internet.
Click “next”
6. Configuration
Click “Next” to configure the plant on the page that opens on the page that opens. Change the plant name to
whatever you want.
Fill out the rest of the form, including country, time zone, plant address, postal code, and grid-connection date.
Then click “next” to go configure the tariff.
Configure tariff by entering solar feed-in tariff and consumption tariff. You can find this info in your latest
electricity bill.
NOTE: Accurate revenue can only be calculated if you have an energy meter installed and the iSolarCloud is
recording grid data. Else, revenue will be calculated using the yield and feed-in tariff.
Then click “next” to connect the installer.
7. Connect Installer
On this page, enter the organisational code of your installer (obtained from them) to connect the plant to their
iSolarCloud account. Your installer should access your inverter data to view your solar monitoring and
troubleshoot any inverter issues.
WattsUp Solar and Electrical Installer Code is AUSA82NS
After entering the code, click “next” and wait for your inverter to be connected for 5 – 10 minutes.
If successful, you’ll get the message “The inverter has successfully connected to the home network.”
Click “Complete”
8. Start Monitoring
Return to the home screen, and you’ll have full access to iSolarCloud monitoring data.
SECTION 2
How to read your iSolarCloud
Operating the iSolarCloud dashboard is intuitive and easy. If you open the iSolarCloud website on your computer, you’ll find its key features in a small column at the left-hand side of the page.
The profile picture is at the top of the column,
followed by the account name. Under this, you’ll find clickable tabs for the iSolarCloud main features.
These are Overview, Device Information, Fault, and Plant Configuration. Clicking any one of these will open its details on the main section of the screen.
Let’s explore all the features.
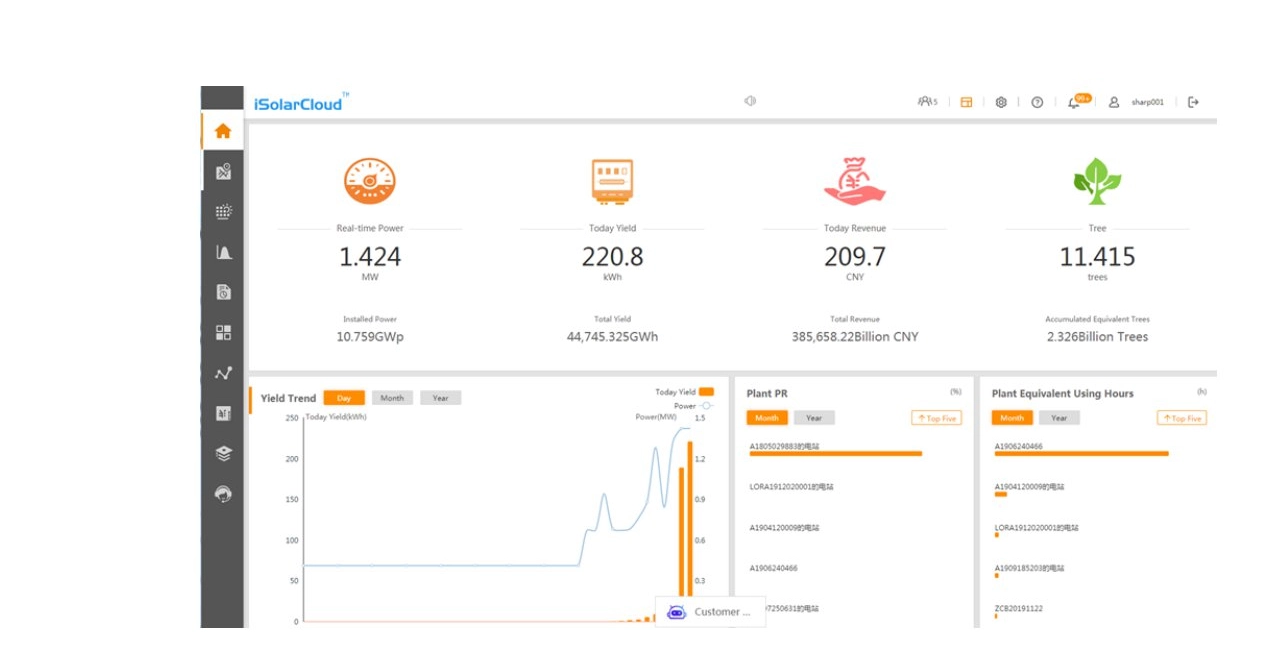
1. Overview
Here you’ll find general solar analytics such as:
Today Yield
Today Yield shows you how many kWh your system has produced for the day. It shows you how well your solar is performing, production-wise.
The best time to check the Today Yield is sundown, preferably at about 5 pm.
Just above Today’s Yield value is “Today’s Revenue.” It shows your solar production’s monetary value (in
AUD) for the day.
Self Consumption
Here you see how much your household has used in the day. It is shown in kWh.
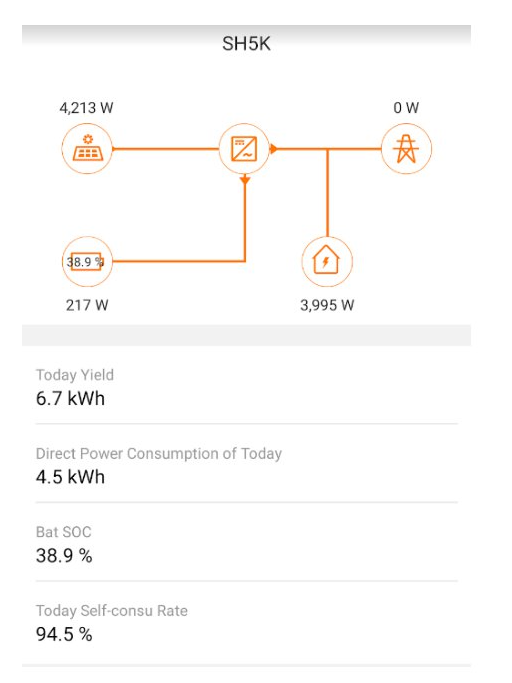
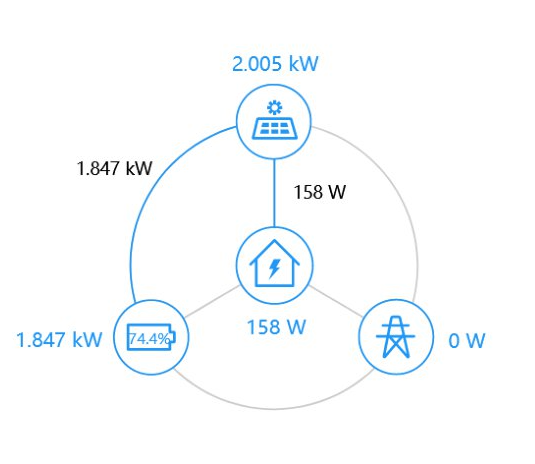
Power-flow diagram
The flow diagram shows how you use your solar power output. It has three nodes and directional arrows flowing from the first node to the two nodes below.
The first node at the top represents your solar system. On top of it, you’ll see the amount of power that your system is producing (then) in kilowatts.
The other two nodes represent your house and the grid.
The directional arrow flowing from your solar panel node to your house node shows the power that goes to your house from what your panels produce.
The arrow flowing from your panels’ node to the grid node shows the amount of power you export to the grid from what your panel produces.
So, the power-flow diagram shows you where the power that your system produces is going in real time.
Real-time power
This shows the power your system produces when you’re checking.
The figure will tally with the amount of power shown in the first node of the power-flow diagram.
Current Month Yield
This section is to the right of “Real-time Power.” It shows what your solar has produced for the month in kilowatt-hours.
Just under the current month yield figure is “revenue this month.” This is the monetary value (AUD) of what your solar has produced for the month.
Total Yield
This section is to the right of the “Current Month Yield,” showing what your solar system has produced since you installed it.
Just under the total yield figure is “Total Revenue.” This is the amount (in AUD) that your system has saved for you since you installed it.
Comparison Charts
Below the Yields section, there’s a PV comparison chart and a Load comparison chart.
The PV comparison chart helps you visualise the power that your system produces over time. You can choose a day, month, year, or total display, and the chart will show you what part of your solar-produced power is self-consumed and what part is exported to the grid over the chosen period.
The Load comparison chart helps you visualise what you’ve used and where you’ve used it from. It compares what you’ve used from your solar (self-sufficiency) and what you’ve used from the grid (purchased energy) over time.
Time Graph
Below the two comparison charts is a time graph that plots your solar output and total power usage data on a time scale. This graph gives a wealth of information.
When considering the consumption part (using the “day” display), the time graph will show you the amount of power you’re using at times in the day. This gives insight into your consumption habits because it shows you when you consume the most power.
The time graph will show you how much power your panels produce at times in the day. It is usually a line curve that starts at a low point, rises steadily, peaks, and drops steadily. You’ll see low power production before sunrise, a steady increase in production as the sunshine increases, peak production when the sunshine is highest, and a decrease in production as the sun goes down.
Using this graph, you can make smart adjustments to your consumption habits to get the best out of your solar system.
For example, you can arrange your high-power usage to coincide with peak production times so that you don’t need more energy than your system produces and then buy it from the grid.
The negative vertical axis (coloured blue) shows the surplus power you export to the grid at different times.
2. Device Information
This tab holds information about your device. If you open it, you’ll find your device serial number, name, type, and status. You don’t need to check this tab. It helps solar installers assess your system errors.
However, if you want to know more about your device, you can click on the “Inverter.” This will open a window with different tabs.
The “General Information” tab has information like voltage, current, and other general data.
The “Active Fault” tab shows you any fault that your system has, and the “Fault History” tab shows you all the faults your system has ever had and their status.
3. Fault
This tab is dedicated to the faults that your system may have. There’s an option to sort the faults to choose any period.
The section also shows the occurrence time of faults, how the fault manifested, and the action you or your installer took.
4. Plant Configuration
This tab has two levels – plant and tariff.
“Plant” is where you’ll find details about the system’s owner. This includes your name, email address, and residential address (where the system is installed).
The “Tariff” section helps add more meaning to the Overview section. By filling in the tariff section, the Overview will show how much (in AUD) your solar power system saves for you. The data for “Today Revenue,” “Revenue this month,” and “Total Revenue” in the Overview section will not be displayed if you do not fill in this “Tariff” section.
Solar savings= power bills savings +feed-in tariff. It’s the amount you no longer pay for power and the amount you get when you export power.
Thus, in the “Tariff” section, there are fields to enter your feed-in tariff and your consumption tariff. The feed-in tariff is what your energy retailer pays you per kilowatt of power you export to the grid, while the consumption tariff is how much you are charged per kilowatt of power you use from the grid. As previously mentioned, you’ll find this info in your latest electricity bill.
Enter these correctly, and the Overview section will show your solar savings.
How to Calculate Your Power Bill Savings
iSolarCloud makes it very easy to calculate solar savings. However, you’ll have to enter the applicable rates before iSolarCloud can help you.
Follow these steps:
- Click on the “Plant configuration” feature in the iSolarCloud dashboard. This reveals two menus – plant and tariff.
- Click on the tariff section
- Enter your consumption tariff and feed-in tariff
- Click save button
- Go back to the Overview
- Your solar savings is shown in today’s revenue, revenue for the month, and total revenue.
However, as mentioned, the solar savings = power bill savings + feed-in tariff.
To see the power bill savings for the day, get the “Self-consumption” reading X Consumption tariff.
You’ll need the PV chart to get power bill savings for any period (say a month). Get the “Self-consumption” reading for the desired period from the PV chart X consumption tariff.
What to do if iSolarCloud is Disconnected?
If communication with iSolarCloud is disconnected, you’ll need to go to your Wi-fi settings and re-establish the connection.
Losing connection means that the iSolarCloud app will not display any energy data. The plant status will be “offline” and show “device with the problem.”
To re-establish the connection, open your Wi-fi setting, and select the home network connection for the inverter.
Once the inverter is successfully connected to the home router, click “Complete.” Then go back to the iSolarCloud app to continue.
Select the option for “more,” then select WLAN configuration. Connect to the inverter WLAN and click “next.” Then select your home Wi-fi network. Input your password and click “connect.” Wait for the message that the inverter has successfully connected to the home router.
Click “complete.” Then go to the home page, select your plant, and you’ll be back online.
Inverter WIFI Monitoring: Where possible our installers on the day of installation assist you in setting up your Inverter WIFI Monitoring App specific to the inverter installed with your Solar Panels. You will be required to download the brand-specific Inverter WIFI Monitoring App from your relevant App Store to your smartphone or relevant device. These Applications require you to provide your personal information for the purpose of registering an account. We will where possible link your monitoring account to our Installer Account if we have one to assist with monitoring your system. You agree, if your Inverter location is too great a distance from your WIFI to connect, or your WIFI has a poor signal, it is recommended that a WIFI Range Extender be acquired which you will be responsible for obtaining.
Without a WI-FI connection, we cannot monitor or manage your system to its optimum. Without WIFI we will only be able to assist over the phone and the Inverter and battery manufacturers will also be unable to manage or monitor the system on your behalf.
In the instance where we were unable to assist on the day with your App download and set-up, you will be responsible for carrying out this set-up in our absence. While we will provide relevant information and instruction within your welcome pack, it is recommended in the first instance, that you contact the relevant Inverter Company (eg Sungrow) for technical assistance and advice, to assist with any App set-up, account details including user name and passwords and App troubleshooting.
SECTION 3 – WIFI RECONNECT
Please Note: The WIFI connection between your inverter and your home WIFI/Hot Spot/Portable WIFI may become disconnected from time to time due to certain circumstances.
Once you login if the if the plant shows the status as “Device with Problem” with a Grey Dot this means that the plant status is offline, and you will need to reconnect your WIFI to the monitoring. This does not mean that your plant is not working, it just means that the WIFI signal between the inverter and the app has been lost.
To reconnect the Wi-Fi please refer to the below process:
Video Link on How to Reconnect: https://www.youtube.com/watch?v=Ttwove7wdUw
Instructions to reconnect:
- Once you are in the app, go to the bottom right-hand side, Where it says “More” Tap on this to open up the next screen.
- From there you will see WLAN Configuration as an option, please select this.
- It will then prompt you to Scan the QR code on the front of your WIFI dongle which is located on the underside of your inverter. It will have a QR code on the front and also a serial number underneath that code starting with a capital letter.
- Once you have scanned that WIFI dongle, the screen will tell you to open your tablet or smartphone’s WIFI settings and to choose the WIFI network that starts with SG with a series of numbers next to it. These numbers will match the serial number on the Inverters WIFI dongle.
- Once you select this network it may say that that network has no internet connectivity which is normal, please stay connected to the SG network and return to the app.
- You should see a message that says successfully connected with a Green Tick and a button that says either CONTINUE or NEXT, press this button.
- It will then open a list of available networks, this is where you will need to select your HOME WIFI (or HotSpot or Portable WIFI network) to join. Once you have selected your WIFI it will prompt you to enter your WIFI password. Please note that the dongle will only connect to a 2.4mhz network such as 4g, it will not connect to a 5g signal if you only have a 5g signal for your home WIFI it will not show in the list of available networks.
- Once you have done this the app will let you know that you have successfully connected the two devices together via the WIFI. It will then say “CONTINUE TO DASHBOARD“
- Once you have returned to the dashboard, please change your phone’s WIFI back to your normal HOME WIFI. If you do not change it back, you won’t be able to view your monitoring as you will still be connected to the SG network which has no internet activity.
- To view your monitoring please tap on the Plant that shows your name and the system’s details.
Contacts for isolarcloud App assistance:
Sungrow has a great tech team who are helpful with App information, set up and troubleshooting.
Should you encounter account issues or require assistance while setting up a plant or assistance with the app in general, we recommend that you contact the helpful team at Sungrow.
Sungrow telephone: 1800 786 476
Sungrow Tech assistance email: service@sungrowpower.com.au